STOCK MARKET DATA, CONTENT AND FINANCIAL RESEARCH SOLUTIONS
Most Relevant Stock Market Data Feeds, Comprehensive Company Fundamentals, Financial Market Research And Content Distribution
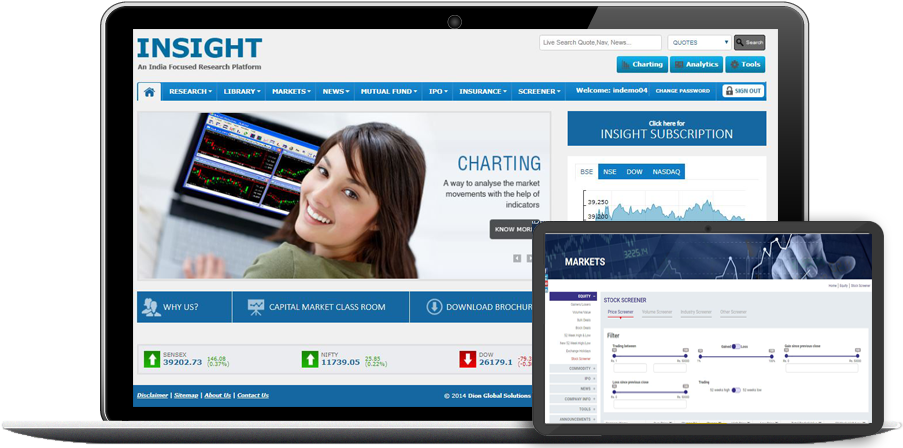
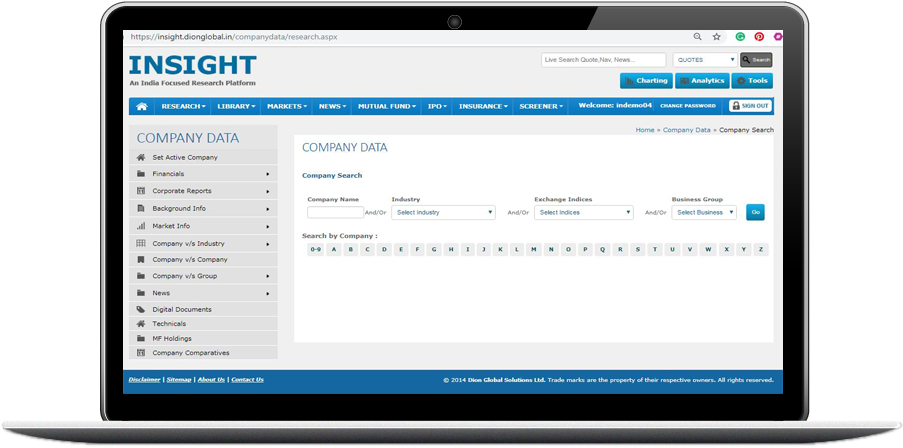
Insight from Dion is an intuitive, easy-to-use exhaustive market research platform. It is India’s leading financial database portal used by eminent equity research houses, educational institutions, corporates, and banks. Insight is Dion’s proprietary financial database portal which includes in-depth information on company fundamentals, mutual funds, Primary and secondary markets, classified news, annual reports library, query builder and select briefs on current events, IPO, derivatives, world Indices, insurance and For-ex data base.
Insight is trusted by leading business schools, corporate and investment research professionals and institutions in India.
Insight offers information across 4 dimensions:
We also provide customize financial database as part of the Insight service. Insight is the product that has evolved through the perpetual gathering of financial data since 1988. The users can log in and use the required information about the listed companies from a vast range of available database.
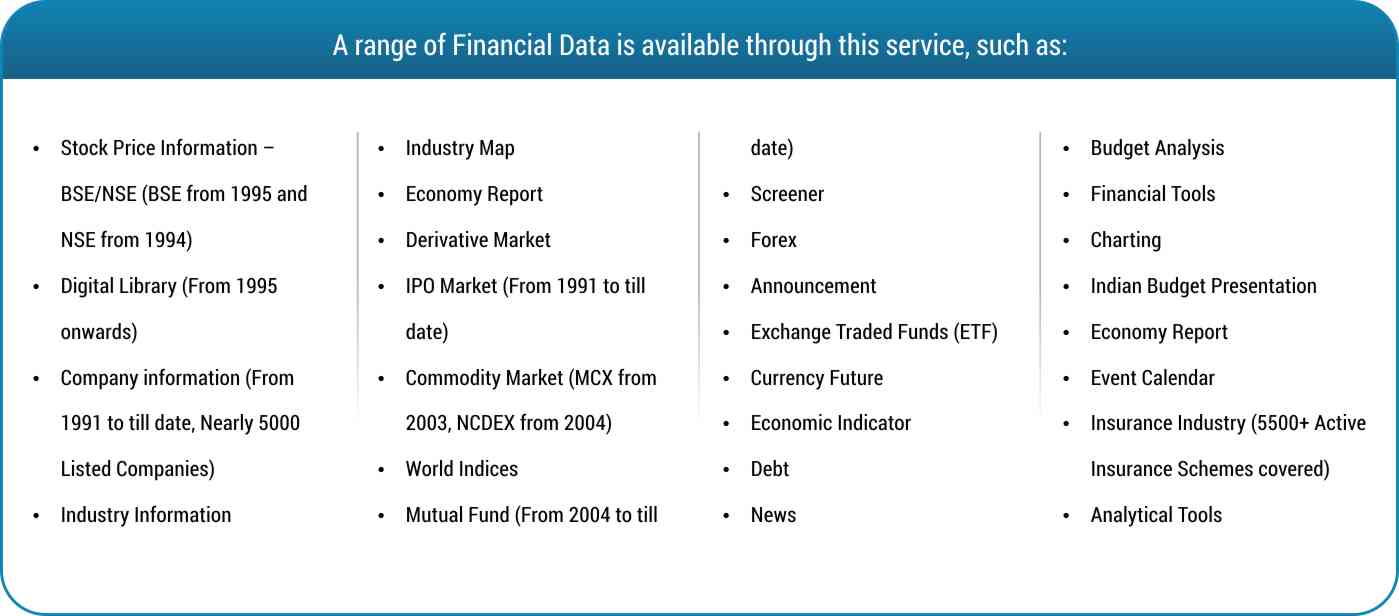
Dion provides Well organized and clean datasets of Raw financial data in .CSV format to the customers who wants to subscribe the financial information for their websites/mobile app etc. Our financial Content services include information on Equity (BSE/NSE), Derivatives, IPO, Mutual Fund,.....
Dion provides Well organized and clean datasets of Raw financial data in .CSV format to the customers who wants to subscribe the financial information for their websites/mobile app etc. Our financial Content services include information on Equity (BSE/NSE), Derivatives, IPO, Mutual Fund, Insurance, News, Corporate Announcements, Currency Futures (MCX-SX), Corporate Information, Commodity, and Exchange Traded Funds.
Dion Global provides BSE, NSE, MCX, NCDEX, NSE F&O, MCX-SX, NSE-FX Market data on delay basis. The delayed quotes are provided by way of CSV data files that can be downloaded by the customer at any time from the FTP Server hosted by Dion Global. The customer can connect to the server through Internet and.....
Dion Global provides BSE, NSE, MCX, NCDEX, NSE F&O, MCX-SX, NSE-FX Market data on delay basis. The delayed quotes are provided by way of CSV data files that can be downloaded by the customer at any time from the FTP Server hosted by Dion Global. The customer can connect to the server through Internet and use FTP client software to download the files. The files on this server are generated on regular interval basis during market hours delayed by BSE 5, NSE 15, MCX 20, NCDEX 20, MCX-SX 15, NSE-FX 15, NSE F&O 15 minutes. Dion provides unique User ID and password which is active only for the agreed period.
We also develop and deliver market data to customers using DOT NET platform and JSON Financial Data APIs. This allows them to easily integrate our data into their web products. The Format is as per DION’s standard format. Dion validates the integrity to give the authentication to customer to access the data from API.
Event Calendar is a tool that indicates all relevant upcoming events in the next 6 months. It also shows the events of past 1 or 3 months. It is designed in a standard calendar UI and contains things like: ....
Event Calendar is a tool that indicates all relevant upcoming events in the next 6 months. It also shows the events of past 1 or 3 months. It is designed in a standard calendar UI and contains things like:
One can easily filter these events by any one of the above-mentioned parameters (e.g., show only AGMs etc.). It also provides an option to make a SUBSET version of this that can appear as a smaller widget in all pages (somewhere). This smaller widget can be called “NEXT 5 DAYS” or “WEEK AHEAD”.
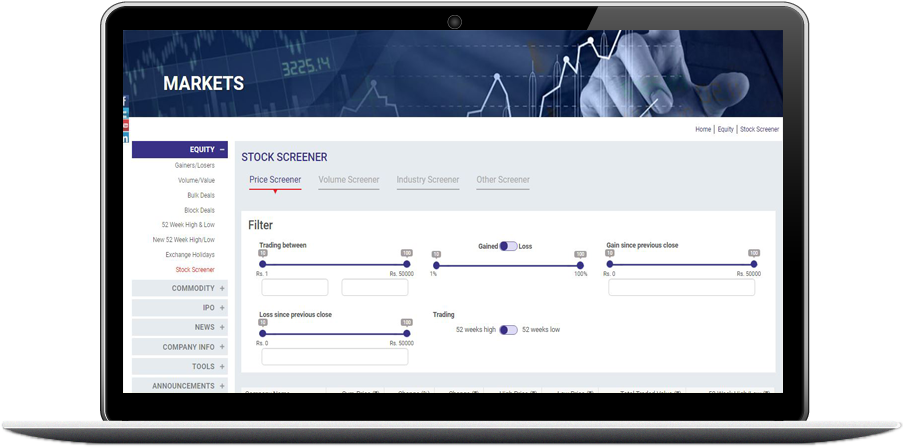
Market screeners allow stockbrokers, retail traders and end investors to select trading instruments that fit a certain profile set of criteria. For example, users are able to screen for stocks by data including price, Volume, market capitalization, and P/E ratio and 52-week price change percentage. Dion’s.....
Market screeners allow stockbrokers, retail traders and end investors to select trading instruments that fit a certain profile set of criteria. For example, users are able to screen for stocks by data including price, Volume, market capitalization, and P/E ratio and 52-week price change percentage. Dion’s Market screeners allow investors and traders to analyze hundreds of stocks in a short period of time, making it possible to weed out those stocks that don't meet the user's requirements and focus on the instruments that are within the user-defined metrics.
A Stock market map is a two-dimensional representation of data in which values are represented by colors. Dion provides two types of Market Maps; A simple Market map provides an immediate visual summary of information, whereas, more elaborate market maps allow the viewer to understand complex data sets in....
A Stock market map is a two-dimensional representation of data in which values are represented by colors. Dion provides two types of Market Maps; A simple Market map provides an immediate visual summary of information, whereas, more elaborate market maps allow the viewer to understand complex data sets in a stock market. The Market map display allows you to gain a quick overview of the performance of BSE and NSE indexes. It displays all the BSE and NSE Indexes with the color comparison according to their market performance. It also displays the performance of all the companies under particular Index with;
This section enables the end users to utilize different tools to analyse the performance of various companies/ industries available in the market. There will be multiple parameters to select and open the chart. The market data will be provided. I.e. Intraday and EOD.....
This section enables the end users to utilize different tools to analyse the performance of various companies/ industries available in the market. There will be multiple parameters to select and open the chart. The market data will be provided. I.e. Intraday and EOD.
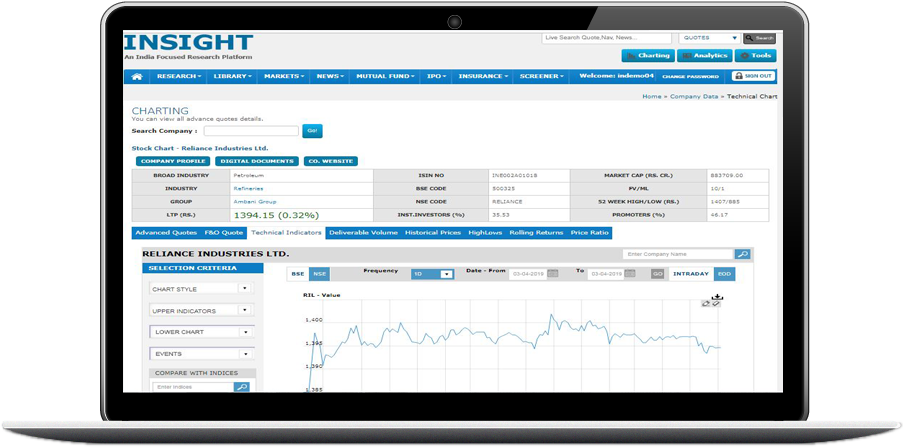
Note: There are many other parameters available for all the charts like Stock Exchange (BSE/ NSE), Frequency (1Day, 5Day, 15Day, 1Month, 3Month, 6Month, 1Year, 2Year, 3Year, 5Year and All) and also any particular date period can be taken as the parameter.
Indicators are additions or overlays on the chart that provide extra information through mathematical calculations on price and volume. They also tell you where the price is likely to go next.
Technical indicators are used most extensively....
Indicators are additions or overlays on the chart that provide extra information through mathematical calculations on price and volume. They also tell you where the price is likely to go next.
Technical indicators are used most extensively by active traders for analyzing short-term price movements. For a long-term investor, technical indicators are mostly used to identify good entry and exit points for the stock by analyzing the long-term trend.
Technical Overlays are the Indicators that use the same scale as prices are typically plotted on top of the price bars
Some Frequently used Technical Overlays are:So why are indicators so important? Well, they give you an idea of where the price might go next in a given market. At the end of the day, this is what we want to know as traders. Where is the price going to go? So, we can position ourselves to take advantage of the move and make money!
Make better decisions faster with our Real-time, Comprehensive and Trusted Financial Market Database!
Speak to our experts for more information
connect@dionglobal.com
